¶ How Can You Use BLE Data for Floodplain Management and Flood Risk Reduction Activities?
When your community receives Base Level Engineering (BLE) data as part of the Risk MAP process, this data will likely be the Best Available Information (BAI) to which your community has access. As a result, your community will be responsible for navigating the "Shalls" and the "Shoulds" of BLE:
Shalls: These are requirements that your community must meet with new BLE data. For communities that participate in the NFIP, floodplain management requirements must be met.
Shoulds: These are best practices or opportunities to use BLE data to benefit your community. Additional flood risk reduction activities and higher standards are encouraged but not required.
Below are descriptions of the typical "Shalls" and "Shoulds" of BLE data.
¶ BLE "Shalls"
- NFIP communities shall use BLE for floodplain permitting accuracy in areas mapped into an Approximate Zone A (meaning no flood elevations are provided) unless a more detailed study exists.
- BLE shall be used as BAI for permitting decisions if a community does not have a more detailed model to support the information shown on its FIRM. Some permitting decisions include required building elevation heights and floodproofing measures.
- Some states have additional requirements for BAI or higher standards. In Region 8, for example, North Dakota and Colorado have additional requirements.
¶ BLE "Shoulds"
¶ 1. Best Available Information (BAI)
Adopt your BLE as BAI.
Communities can adopt BLE data as BAI through local floodplain ordinances. This process is driven by a community vote, typically involving the release of BLE data on preliminary FIRM panels with an FIS report, followed by a formal appeal and comment period.
- NFIP regulations identify minimum requirements that communities must fulfill to join and stay in the program; some BLE products may not meet these minimums. Requirements may vary by community.
- BLE is only made regulatory when a community adopts it into its floodplain management ordinance. At this point, it ceases to be BLE and becomes regulatory flood data.
- Insurance agents and lenders must use the effective FIRM when setting insurance rates and determining flood insurance requirements.
- Flood insurance premiums and requirements may only change for a property when the effective FIRM is revised or amended.
Region 8 Example Provisions:
"The Community has elected to adopt [Title of Study] Base Level Engineering data as Best Available Information to regulate its floodplain development, supplemented by the effective FIRMs and FIS.
Where Best Available Information contradicts the FIRMs or FIS, the Community shall use the more restrictive data."
¶ 2. Risk Assessment and Analysis
Understand what is changing.
BLE data can be used to understand a community’s exposure to flood risk and estimate the potential impacts of flood events. Potential use cases include:
-
Identifying structures newly added to flood hazard areas.
-
Identifying areas that have a higher flooding probability and are more likely to incur frequent losses.
-
Analyzing asset vulnerability by comparing flood depths to an asset’s footprint.
-
Understanding where buildings and other infrastructure may experience greater damage from intense hydrodynamic forces of fast-moving water.
.png)
BLE Floodplain Boundary Maps: Show WHERE assets are located..png)
BLE Depth Grids: Show HOW DEEP floodwater might get.
.png)
BLE Water Surface Elevation Grids: Show HOW HIGH floodwater might get..png)
BLE Probability Grids: Show HOW FREQUENTLY flooding is expected..png)
BLE Velocity Grids: Show HOW QUICKLY and WHAT DIRECTION water is expected to flow.
BLE data can be used as input to Hazus to estimate the economic loss from flood events. Hazus is a nationally applicable, standardized methodology that estimates potential losses from earthquakes, hurricane winds, floods, and tsunamis. Managed by FEMA's Natural Hazards Risk Assessment Program, Hazus uses state-of-the-art GIS software to combine inventory information, hazard extent and intensity data, and damage functions to display hazard data and estimate disaster impacts, such as structural damage and economic loss.
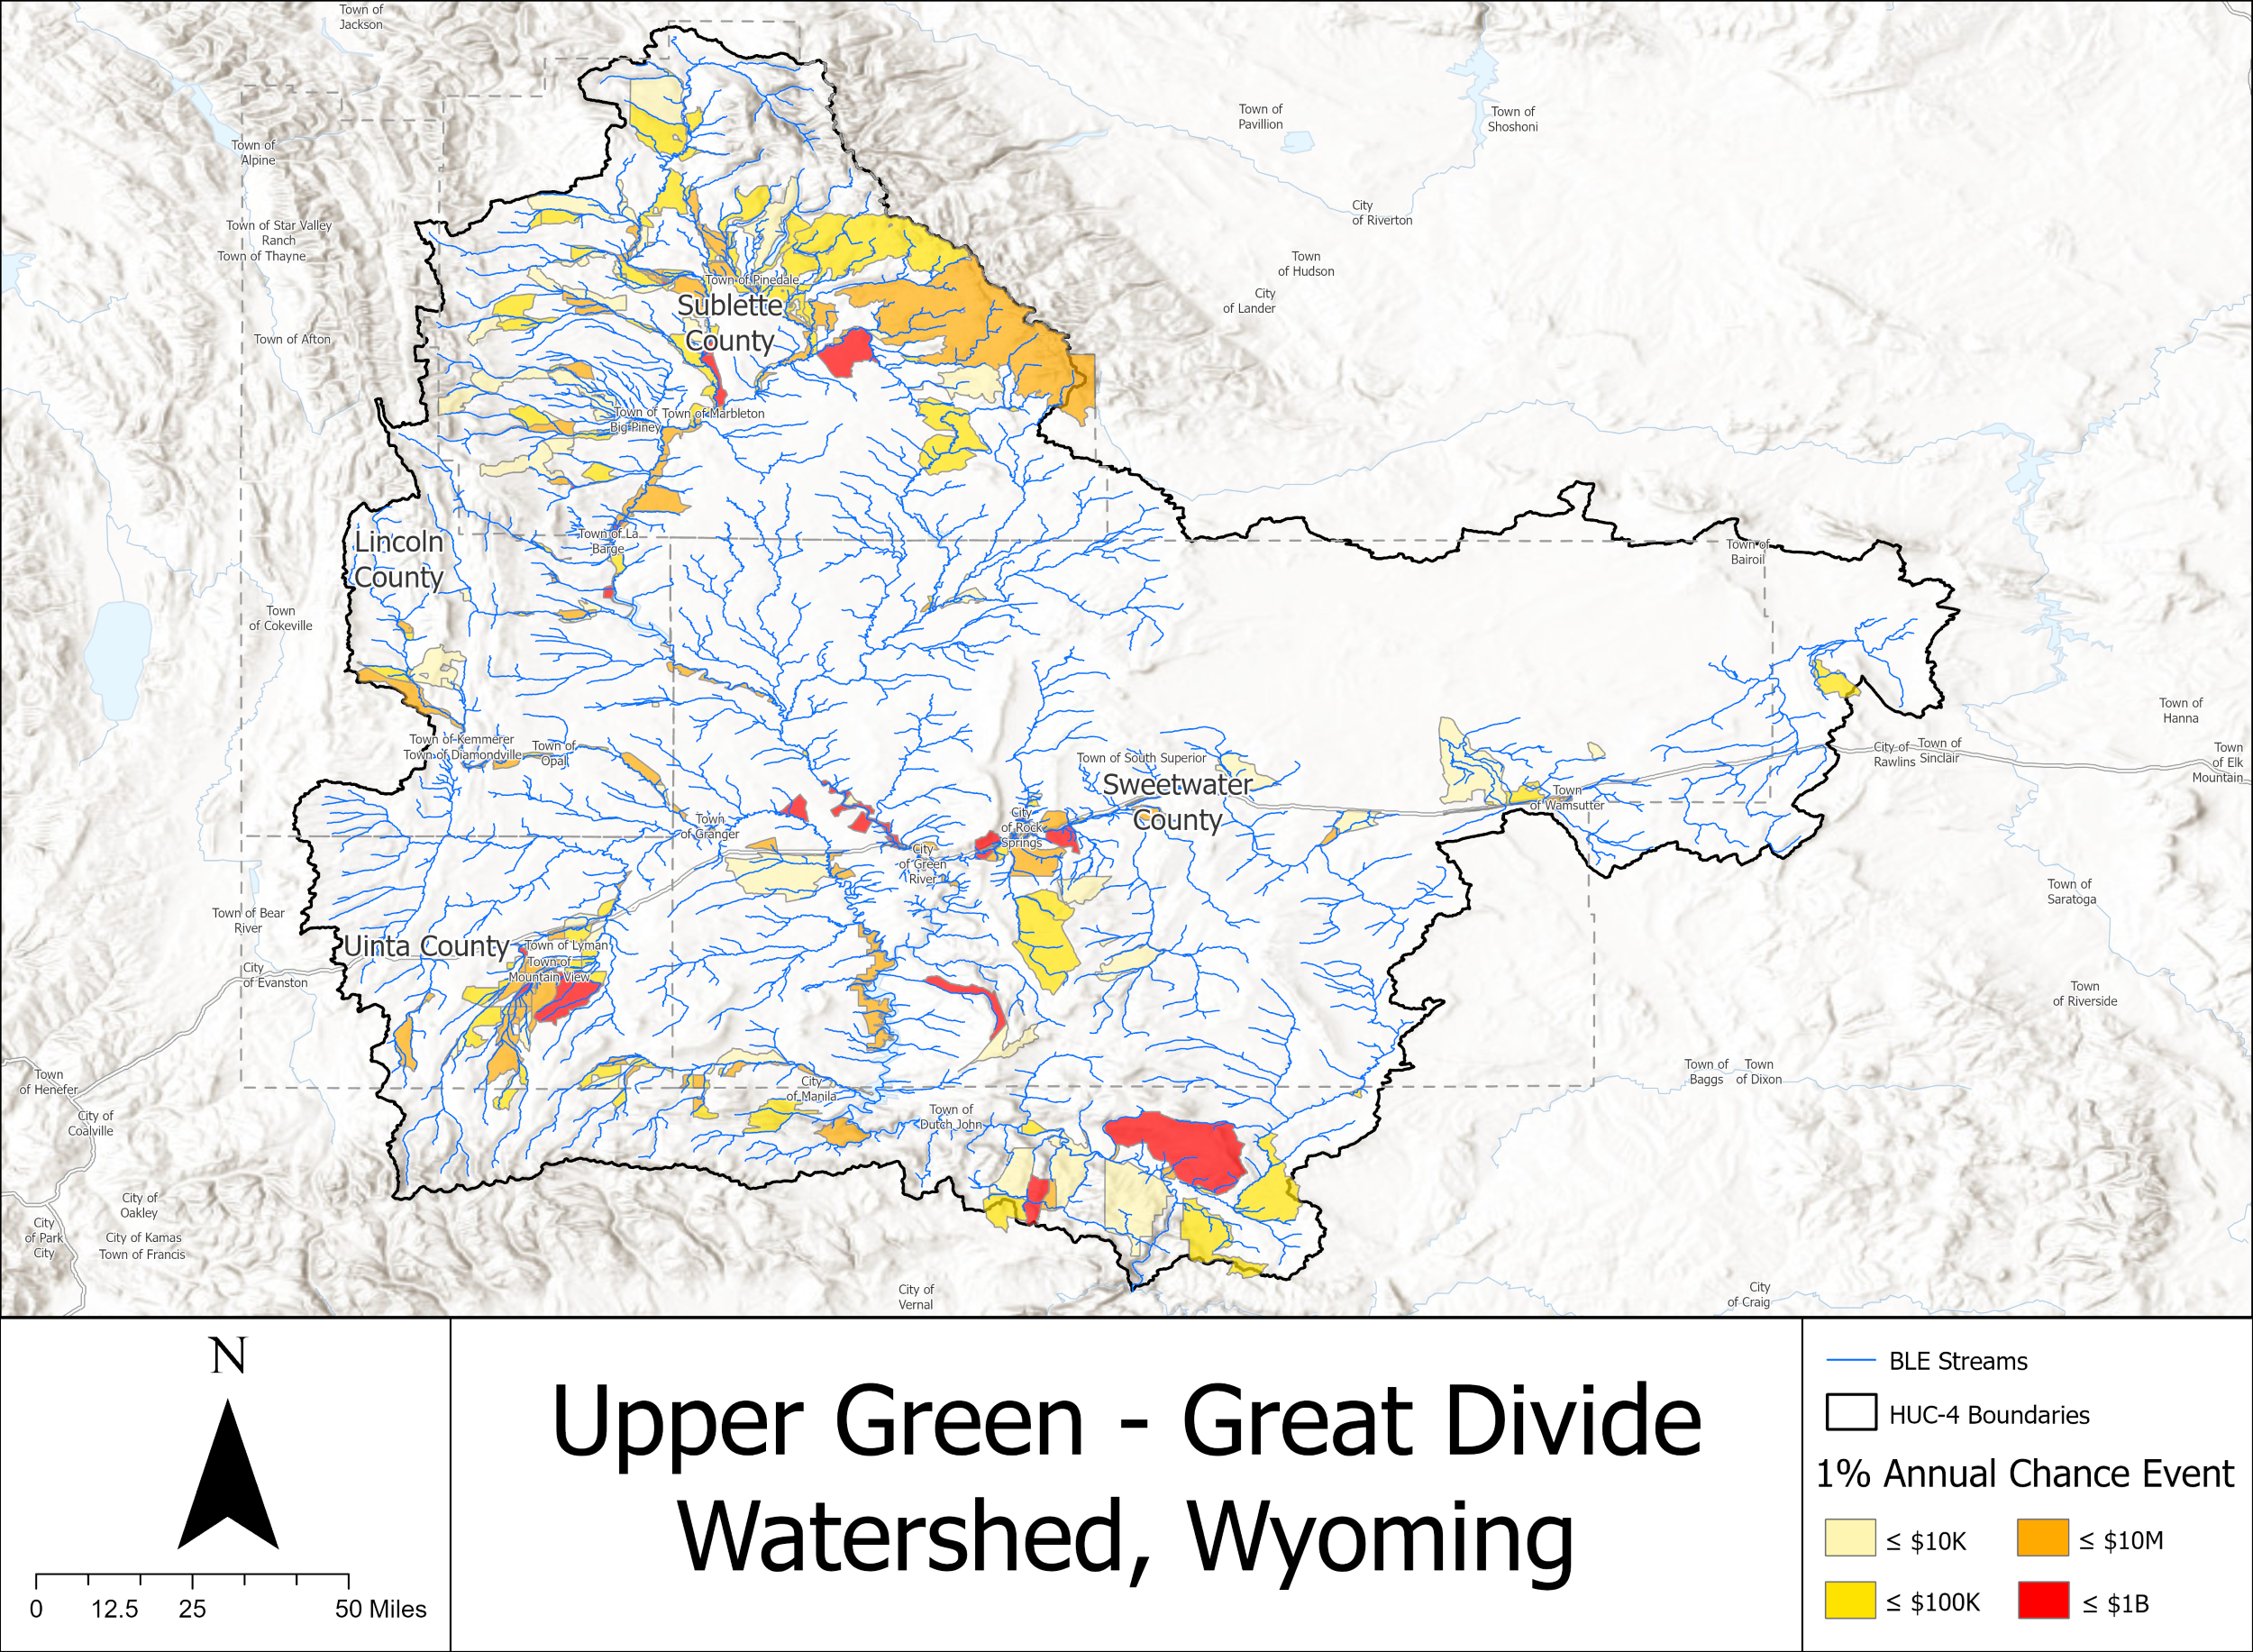
Hazus Flood Risk Assessment results and BLE Streams in the Upper Green-Great Divide Watershed.
The figure above illustrates the total economic loss in dollars estimated by Hazus from the BLE-derived 1% annual chance flood event. The map shows the Hazus results overlaid with BLE streams for areas within the Upper Green-Great Divide Watershed. Losses are less likely to be underestimated when using BLE data instead of effective data, as BLE may provide a greater amount of information (i.e., more mapped streams, in this instance) on which to base loss values. Determined by averaging the losses of Census block-level data, Hazus results indicate that economic loss from the 1% flood is most concentrated in areas where more heavily developed land or high-value infrastructure intersects flood-prone areas with high flood depths.
¶ 3. Enhanced Flood Mapping
BLE can be compared with the effective FIRM's Special Flood Hazard Area (SFHA) boundaries to identify discrepancies in mapped flood risk. Potential use cases include:
-
Using new, detailed flood information to identify high-risk areas not currently mapped into the SFHA.
-
Analyzing probability, velocity, and depth to approximate a flood event's impact on given location.
-
Identifying vulnerable areas or critical open space not marked on the effective FIRM.
-
Publishing maps to communicate regulatory implications.
.jpg)
Identify High-Risk Areas: BLE Floodplain Boundary Maps can identify high-risk or potential mitigation areas, like Areas of Mitigation Interest (AOMI). Image Source
.jpg)
Inform Zoning Decisions: BLE Velocity and Depth Grids can inform zoning decisions and keep critical facilities and residences out of harm's way. Image Source
¶ 4. Mitigation and Planning
Local governments can perform BLE-informed risk analyses to prioritize projects and risk reduction measures. Potential actions include:
-
Comparing flood extents with building footprints and community maps to determine areas of higher and lower risk.
-
Making informed decisions about where development is suitable, what kinds of developments or mitigation projects may be appropriate, and where conservation of open space may help decrease the occurrence, extent, and severity of flood damage.
-
Determining the best flood protection measures to incorporate into site and building design.
-
Evaluating transportation and evacuation routes.
.jpg) Mitigation Strategies: BLE can help determine appropriate structural and nature-based projects to reduce flood risk.
Mitigation Strategies: BLE can help determine appropriate structural and nature-based projects to reduce flood risk.
.jpg)
Project Prioritization: BLE can be used to prioritize projects by risk, cost, and other metrics. Image Source
.png)
Flood Risk Communications: BLE can be used to prioritize areas that need additional or focused flood risk communications and tailor materials to those key groups.
¶ 5. Grant Applications and Capital Requests
Fund projects to address flood risk.
BLE data can be used to justify fiscal support from grant or capital programs. Possible uses include:
- Supporting the request narrative using maps and figures.
- Showing need and urgency with vulnerability and impact data.
Improve Grant Applications: BLE can be used to show the need, urgency, and impact of mitigation projects. Image Source
.jpg)
BAI as Supporting Data: BLE can be used as the BAI when applying for grants and other funding.
.jpg)
Tailored Applications: BLE can be reformatted and tailored to individual grant applications, as some grants require specific types of data inputs. Communities can use Mitigation Technical Assistance for help with this.
¶ 6. Updating Regulations
Inform higher regulatory standards.
BLE data can guide management standards that exceed NFIP requirements in areas where flood hazards have not yet been identified or mapped or in areas that have been mapped into the floodplain but lack flood elevation data. If your community chooses to adopt BLE data as the regulatory standard, you may choose to do the following:
- Require additional flood risk information and associated documentation (Elevation Certificates, Floodproofing Certificates, and Substantial Damage and Improvement determinations, etc.) in permit applications.
- Require buildings to adhere to certain design specifications beyond those that FEMA established standards, such as higher standards for minimum elevations and floodproofing measures.
- Place restrictions or limitations on the use of fill for development when necessitated by flood safety standards.
.jpg)
Fill Limitations: BLE can demarcate areas of fill use before they appear on the FIRM.
.jpg)
Critical Facilities: BLE can inform the boundaries of critical facility locations.
.jpg)
Freeboard: BLE can show how flooding will impact areas differently depending on the required freeboard.
.jpg)
Substantial Improvement/Substantial Damage: BLE can be used to identify new SFHAs, estimated BFEs, and at-risk structures to proactively regulate substantial damages and improvements in these areas.
¶ Flood Info Connect
Flood Info Connect is a web-based resource (application) that connects community input to relevant flood risk information. During the next phase of the Risk MAP process, flood risk information will be available as Flood Risk Products (FRPs). Flood Info Connect can help community officials proactively identify FRPs that best align with their community’s risk reduction goals by outlining technical data, tool proficiencies, and digestible how-to examples.
-
Explore Flood Info Connect
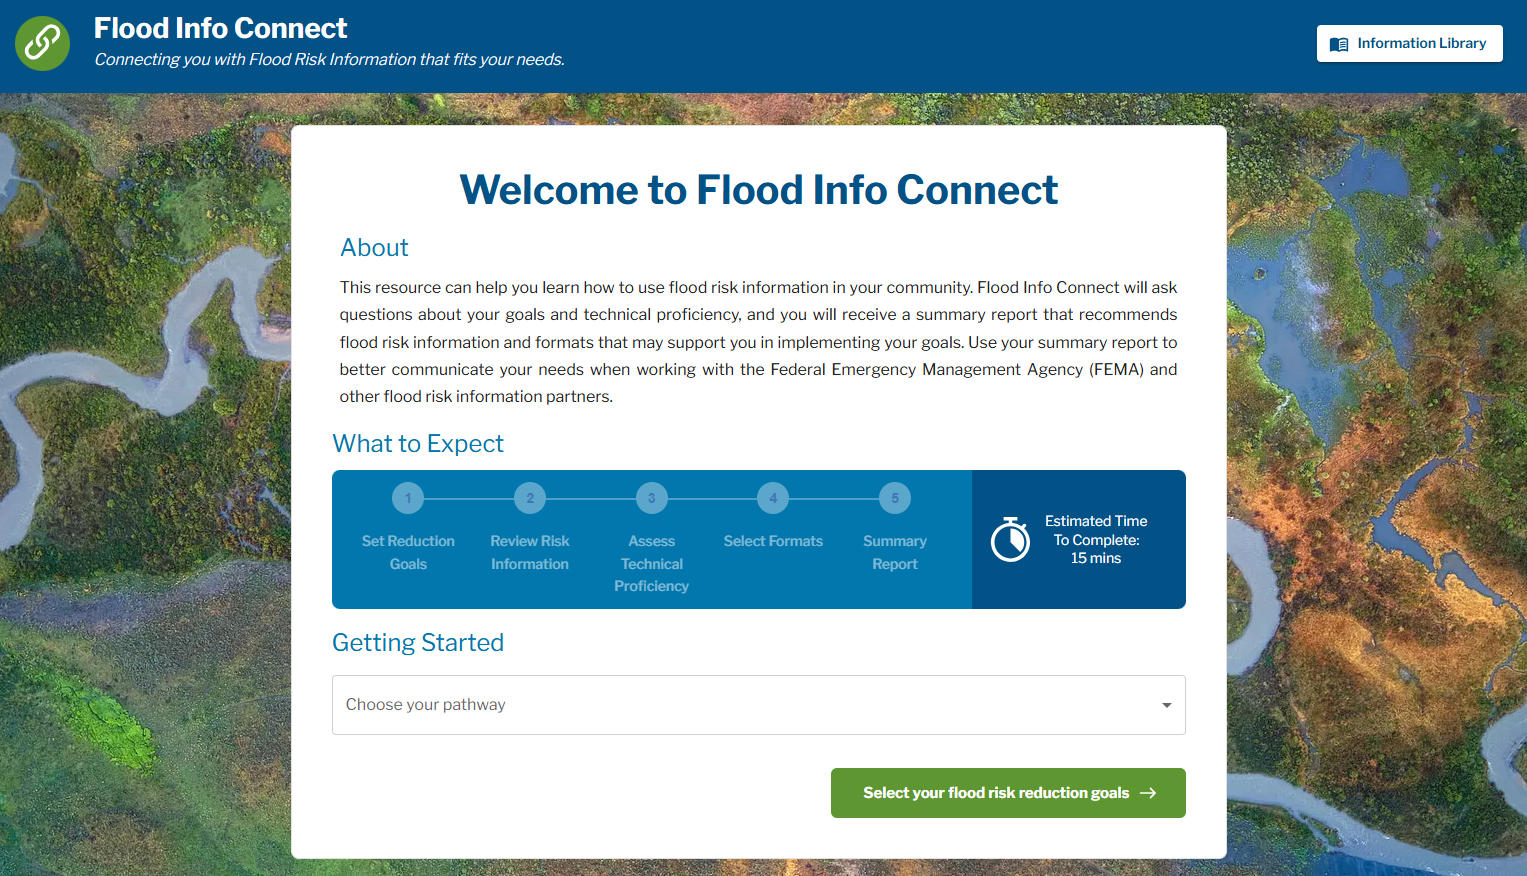
Flood Info Connect Homepage